Alerting: Creating webhook actions
Sergii Bondarenko
Tags: Alerting
In this part of our series we will create a new webhook action and then use it to send notifications to it.
Webhook actions
For the webhook action, find the Add button in the Action panel header, click it and select Webhook in the menu.

Now you see the webhook action form with the empty Url field.

The Url field is a required field. To get a webhook URL for this test, go to https://webhook.site/. There you find the URL created for you under Here’s your unique URL... text. Copy it.

Now, go back to Signals app and paste the URL in the Url field of the Webhook action.

Scroll down to Body and put the following text in the text area:
Avg ticket price: {{data.mysearch.aggregations.metricAgg.value}}
Notice, you can use Mustache to get access to the watch response object and create nice templates. The keys data.mysearch are constant keys that are used by the wizard watch to store Elasticsearch response body and aggregation results. The aggregation values are available behind metricAgg and dateAgg constant keys. In the Preview text area, you can see the response created by the Mustache template. This message will be sent to the webhook server.

Note that in the near feature, we will also provide a possibility to see the Elasticseatrch response directly from the action form. Now you can see the response in other watch modes: Json and Blocks. Also, the response is provided in the browser console with the verbose mode enabled.

Click the Create button to store the watch.

Results
You will be redirected to the Watches page. Now, the table contains the watch. The Last Status of the watch should be Triggered.

To inspect the watch action, click the inspect button.

You will be redirected to the Execution History page where you can see the watch responses. Click on an Id and see the details.

Finally, go back to https://webhook.site/ and see your POST has arrived.

Activating the JSON mode
Let’s see more about the wizard watch query, condition, and Elasticsearch response. Go to Watches table and click on the watch Id.

While on the Define Watch page, scroll down to the Definition panel and change Type to Json.
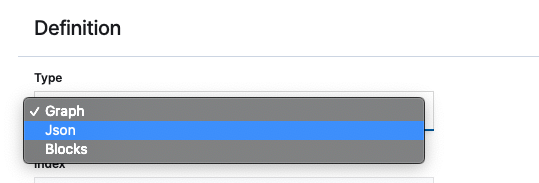
Now you see the watch query in the Checks text area. Click on the Execute button and you see the Elasticsearch response. You can edit the watch query and condition and execute the watch to see new results.

Where to go next
Read the next part of this series on how to add actions (coming soon)
Read the previous part of this series on how to use the Kibana graph mode
Read the previous part of this series on how to use the Kibana block mode
Deep dive into Signals by reading our fine documentation
Ask any question on our Signals Alerting forum
Image: Shutterstock / Ateverna
Published: 2020-02-19
Questions? Drop us a line!
Other posts you may like
Alerting: Creating webhook actions
Sergii Bondarenko || 2020-02-19
How to use the Signals Alerting Kibana plugin to create Elasticsearch alerts and push notifications to any webhook endpoint ...
read more
Alerting: Using the Kibana Graph Mode
Sergii Bondarenko || 2020-02-03
How to use the Signals Alerting Kibana plugin to create simple yet powerful watches and alerts with a few simple clicks ...
read more
Alerting: Using the Kibana Block Mode
Cliff Staley || 2020-02-10
How to use the block mode of the Kibana Signals Alerting plugin to easily create watches, thresholds and notifications. ...
read more


