Alerting: Using the Kibana Block Mode
Tags: Alerting

In the former post “Introduction to Signals", we have created a simple watch that triggered a signal when a number of logs occurring within a recent hour dropped below a certain threshold. We have used the “Graph” mode to define a watch. In this post, we present the “Block” mode, which uses JSON syntax and provides richer capabilities. We will present the anatomy of the watch and provide a demo that triggers a signal when a number of 200 response codes drop below 95%.
The anatomy of watch
Each watch consists of three major building blocks:
Triggers
that define when a watch will be executed.Checks
that analyze the situation to be watched. These may be:
Inputs
which pull in data from a source such as an Elasticsearch index or an HTTP service;Conditions
to analyze the gathered data using scripts and decide whether to proceed with execution or to abort;Transformations and calculations
to transform the gathered data into a -format that subsequent operations may require.Each watch can have several checks, which are executed as a chain. Each action of a watch can also have a chain of checks.
Actions
that are executed if all preceding conditions are met.
These can be either notification alerts via Email or Slack, actions can also save data onto ElasticSearch or invoke external HTTP services.
Each watch can have several actions. Action-specific checks can be used to decide which actions are executed in which situation.
Block mode checks’ definition
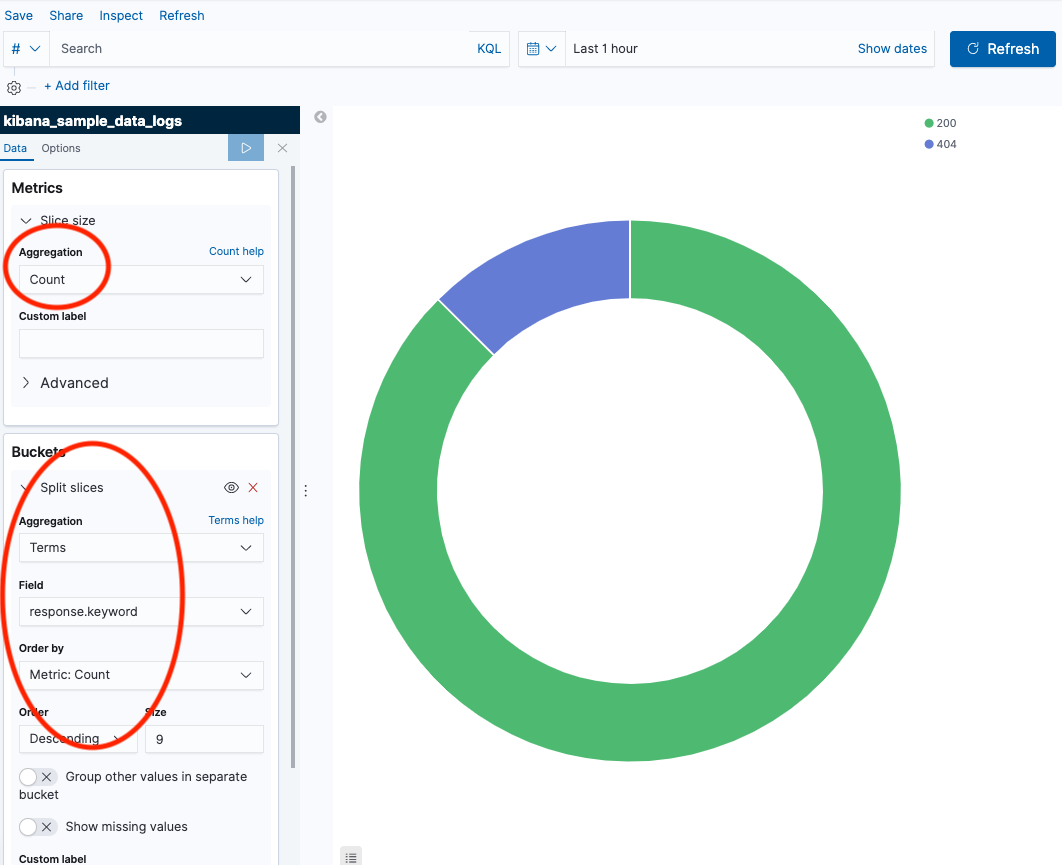
Let us now focus on our scenario: send a notification, when a number of logs with successful status codes drops below 95% (status code equal to 200). We will start by using the Kibana visualization panel to draw a pie chart with a distribution of response codes.
Within Kibana visualizations, we simply select count aggregation and create buckets based on terms of a response.keyword field. As a result, we get a pie as below:
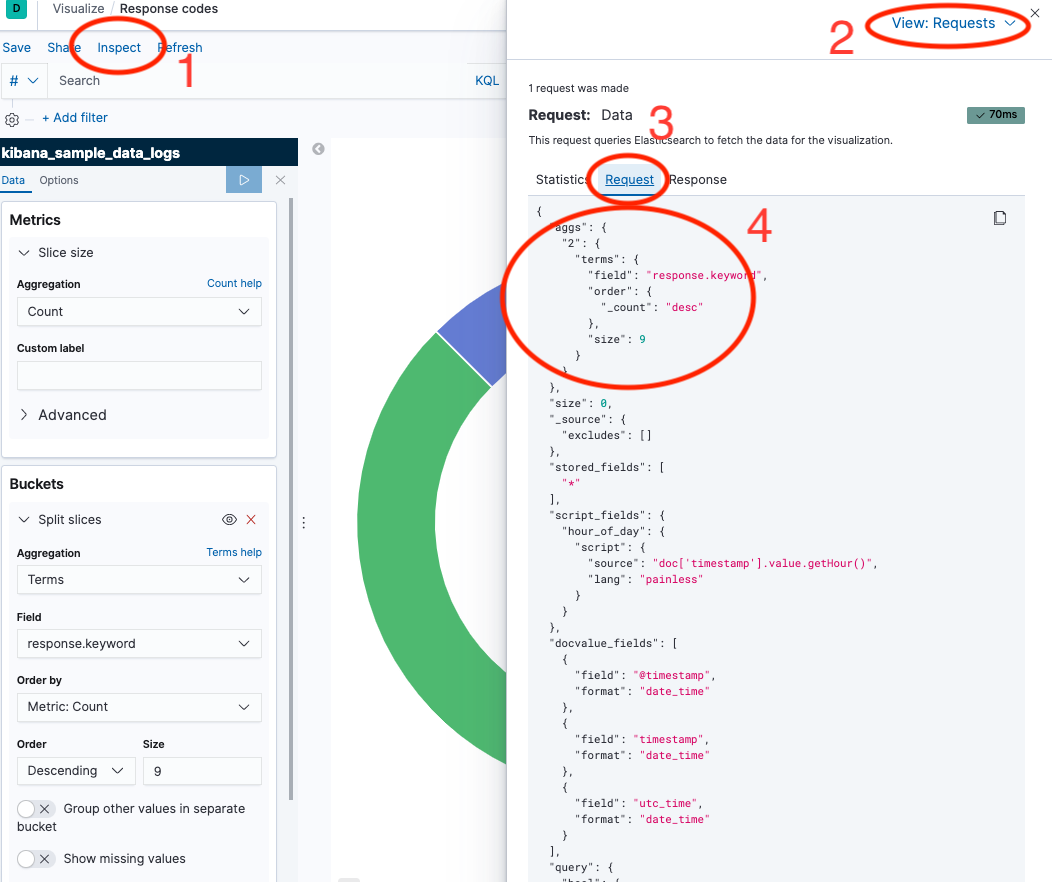
What is even more convenient, we can use Kibana to see the created Elastic Search query. We will use it later when creating a block watch.
We can now move back to the Signals panel in Kibana and duplicate the check from the former demo. Then we edit it and switch this time from “Graph” type into “Blocks”. In the beginning, we do have two blocks:
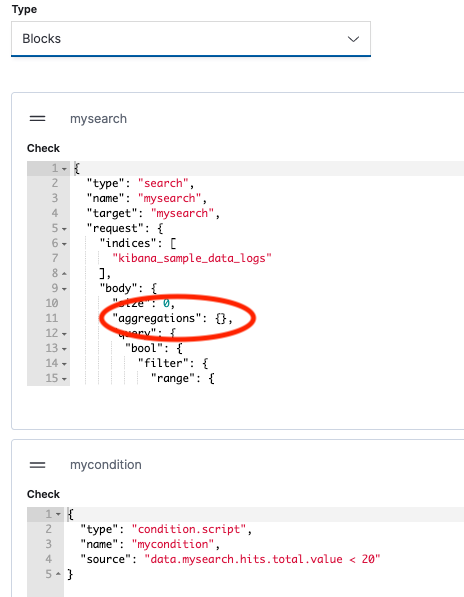
We fill the aggregation field with an aggregation created in Kibana visualizations:
"aggregations": {
    "count_reponse_codes": {
    "terms": {
        "field": "response.keyword",
        "order": {
            "_count": "desc"
        },
        "size": 10
    }
}
The
“Execute”
button on the right side allows to see the output of the query, which should be similar to:"buckets": [
{
"doc_count": 219,
"key": "200"
},
{
"doc_count": 12,
"key": "404"
},
...
]
In our scenario, we want to extract occurrences of 200 status code in query results. To do so, we create a calculation by clicking the
“Add”
button, specify “Calc”
and click add again. Please note that we can also drag-drop checks to change their ordering. The calculation will contain the following code:{
"name": "calc_200_response_codes",
"type": "calc",
"source": """
for (bucket in data.mysearch.aggregations.count_reponse_codes.buckets) {
if (bucket.key == '200') {
data.number_of_200_codes = bucket.doc_count;
}
}
"""
}
The code iterates over the buckets to figure out the one that contains proper status codes. Please note that we use
data.mysearch
prefix to access the data and mysearch is defined within the first check as a target of a query. A number of occurrences is assigned to data.number_of_200_codes variable.Then we add “Condition” check to run an action when a number of 200 response codes is below 95%:
{
  "type": "condition.script",
  "name": "200 codes over 95%",
  "source": "data.number_of_200_codes <= 0.95 * data.mysearch.hits.total.value"
}
We can run the code to see if all the checks evaluates which ends our demo. If all checks evaluate to true to an action is called.
Kibana is widely used as a dashboarding tool that visualizes data stored in Elasticsearch. In this post, we have shown how easy it is to convert dashboards into the active watches.
Where to go next
Read our introduction article on Signals
Deep dive into Signals by reading the documentation
Ask any questions yu have on the Signals forum
Image: shutterstock / locrifa
Published: 2020-02-10
Summarize this with AI
Questions? Drop us a line!
Other posts you may like

Search Guard Alerting vs Elastalert: Which one to use?
Jochen Kressin || 2024-08-20
We take a look at Elastalert and compare it with Signals, the free Search Guard Alerting solution for Elasticsearch and Kibana and explain why Signals is the winner.
read more

Alerting: Using the Kibana Block Mode
Cliff Staley || 2020-02-10
How to use the block mode of the Kibana Signals Alerting plugin to easily create watches, thresholds and notifications.
read more
Alerting: Using the Kibana Graph Mode
Sergii Bondarenko || 2020-02-03
How to use the Signals Alerting Kibana plugin to create simple yet powerful watches and alerts with a few simple clicks
read more