Signals Alerting: First steps
Tags: Alerting

Signals is a brand new feature from the Search Guard team that allows to easily trigger actions based on data stored in Elasticsearch clusters.
As an example, one can think of an e-commerce platform that uses Signals to detect when the number of failed payments increases and reaches a certain threshold. There are plenty of use cases across the industries and Signals allows us to easily extract value from the data. Several scenarios can be applied without writing a single line of code.
In this post, and others appearing later, we present the Signals in step-by-step demos. We hope this will introduce it's features and allow you to implement your own scenarios. We will start with a simple watch that triggers Slack notification when a number of logs drop.
Signals installation
In future Signals will be bundled with Search Guard, thus no extra installation steps will be required. At the time of writing this post (December 2019), Signals is released as Beta. In order to test it, the Signals versions of the Search Guard plugin for both Elasticsearch and Kibana need to be installed. The latest versions can be found on Search Guard versions matrix. Versions containing Signals are listed on the bottom of the page. The same installation steps are required like for Quickstart, but with specific plugins’ versions chosen.
Signals Demo
Assume we have successfully installed Elasticsearch and Kibana and both are powered with Search Guard plugins that support Signals.
Kibana ships by default with sample datasets that can be easily installed by clicking “Add sample data” link on the Kibana homepage.
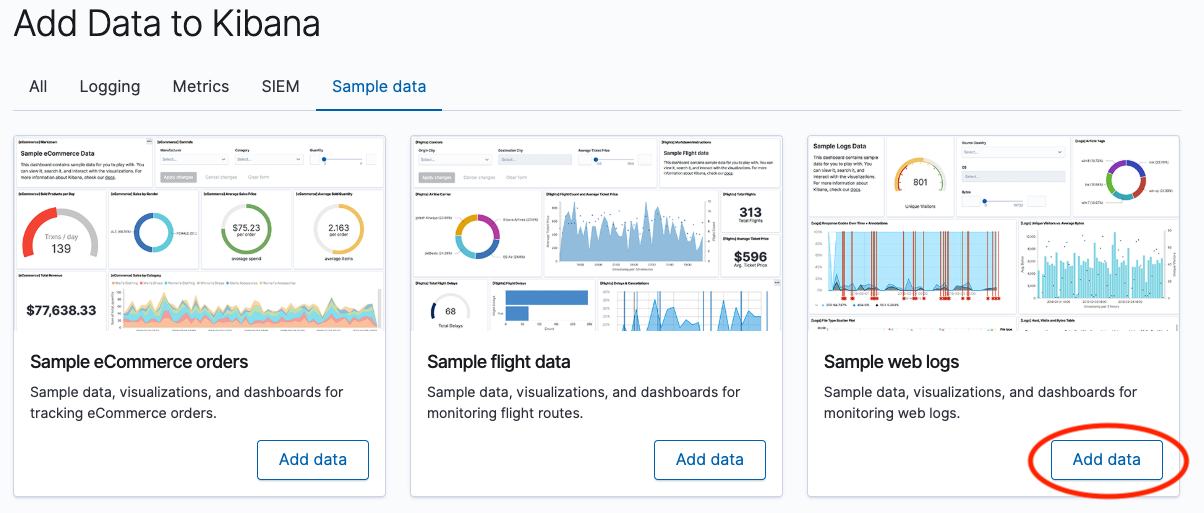
Let us add “Sample web logs” for the purpose of this demo. Once data is added, we can browse it through “Discover” panel in Kibana.
In our demo, we will send Slack messages when a number of incoming logs drop below a threshold. To make it work, we need to start with a configuration of a Slack app, so that we can send the messages.
We start with creating a Slack workspace and clicking “Create New App”. When an app is created, we open “Incoming Webhooks” tab in application settings. A webhook is a URL where we can send Slack messages to a specified channel through the API without extra authentication. Authentication is done by tokens contained within the URL.
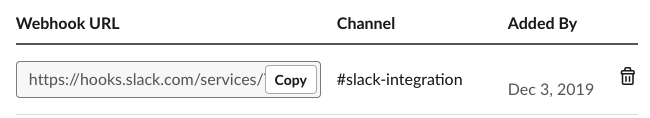
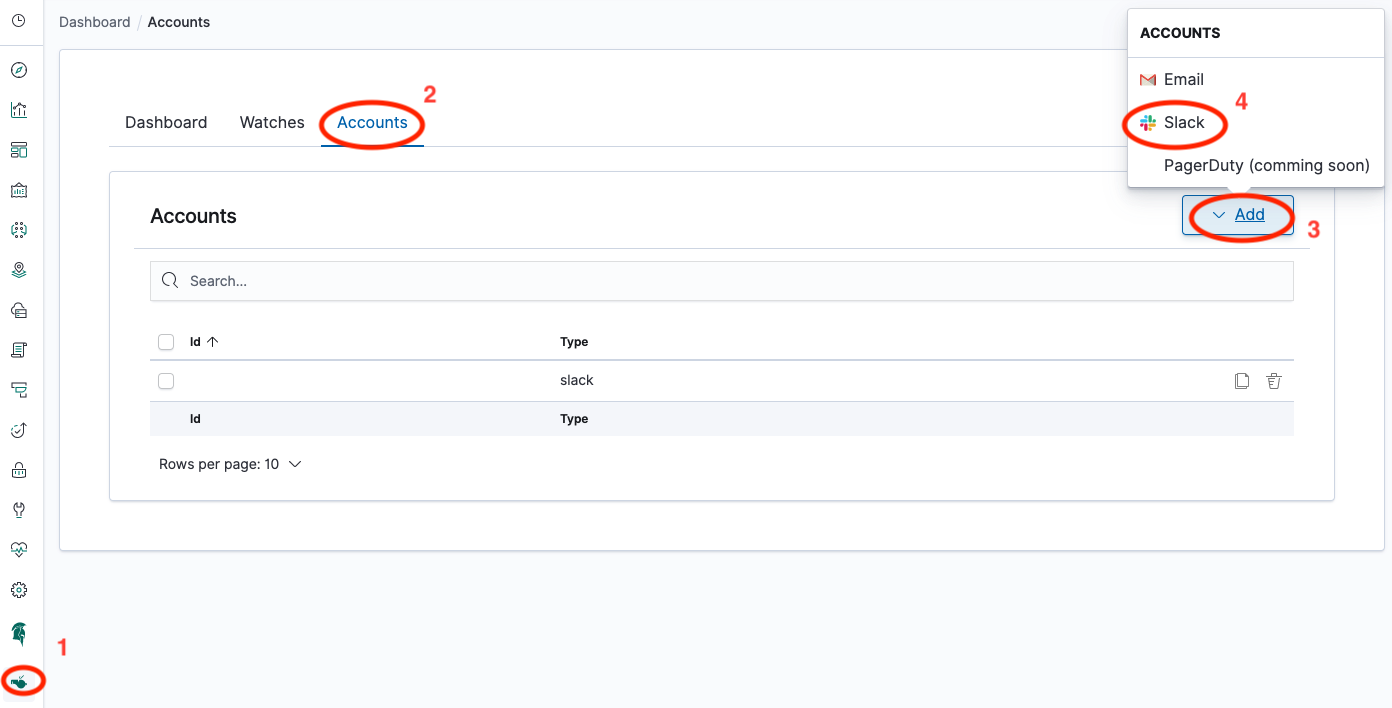
The webhook URL is the only thing we need for the SearchGuard configuration. We click “Signals” on bottom of Kibana menu, switch to “Accounts” tab, “Add” new account and choose Slack:
We also need to provide a name for our account and copy the webhook URL.
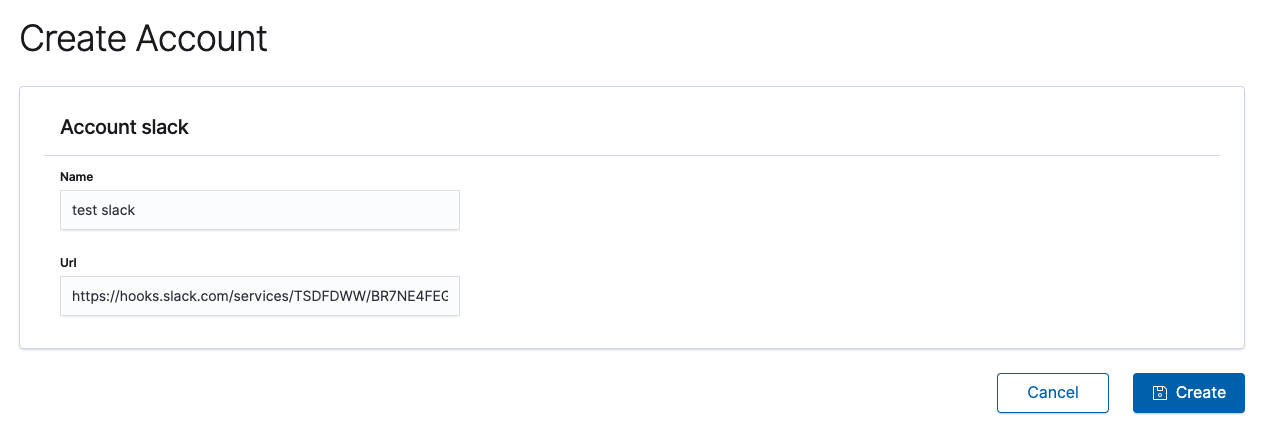
This finishes Slack integration. Please keep in mind that once the Slack account is configured, it can be used across several watches.
Let us now define the first watch. In Signals, we choose “Watches” tab and click “Add” button. We provide some meaningful name for the watch and scheduling mode. For the purpose of this demo, we use “by interval” mode scheduled every minute. “Definition” section allows specifying the rule that triggers a signal. We choose “Graph” mode, where the complete watch may be created by clicking Kibana UI:
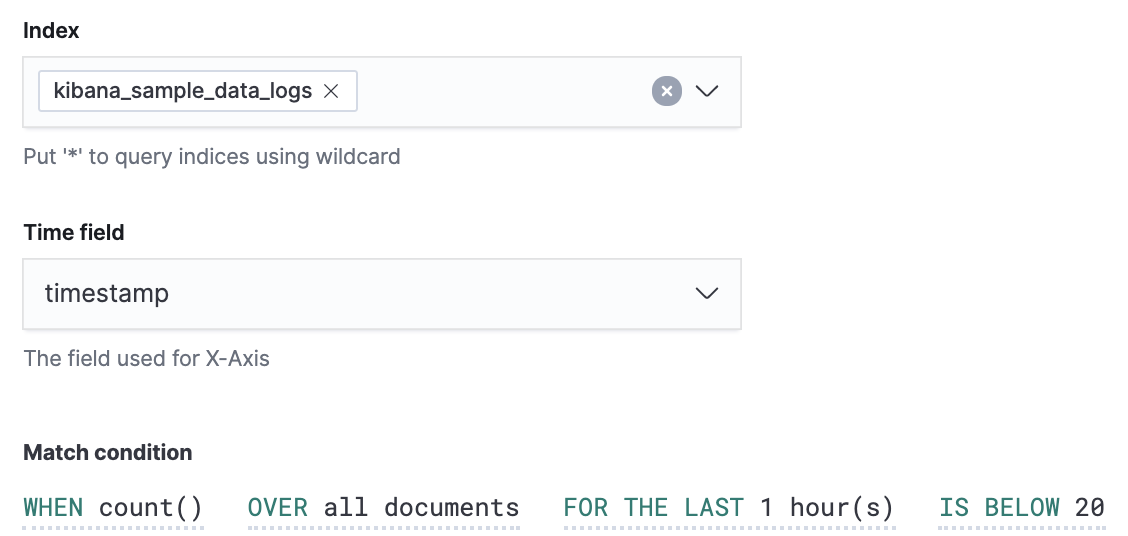
We specify an index and its timestamp, with data that will be used to create rules. “Match condition” will trigger signals whenever the number of all documents within an index in the last hour is below 20. This simple check is extremely popular in practice. Once the number of logs decreases dramatically, this means there is something wrong happening with the system.
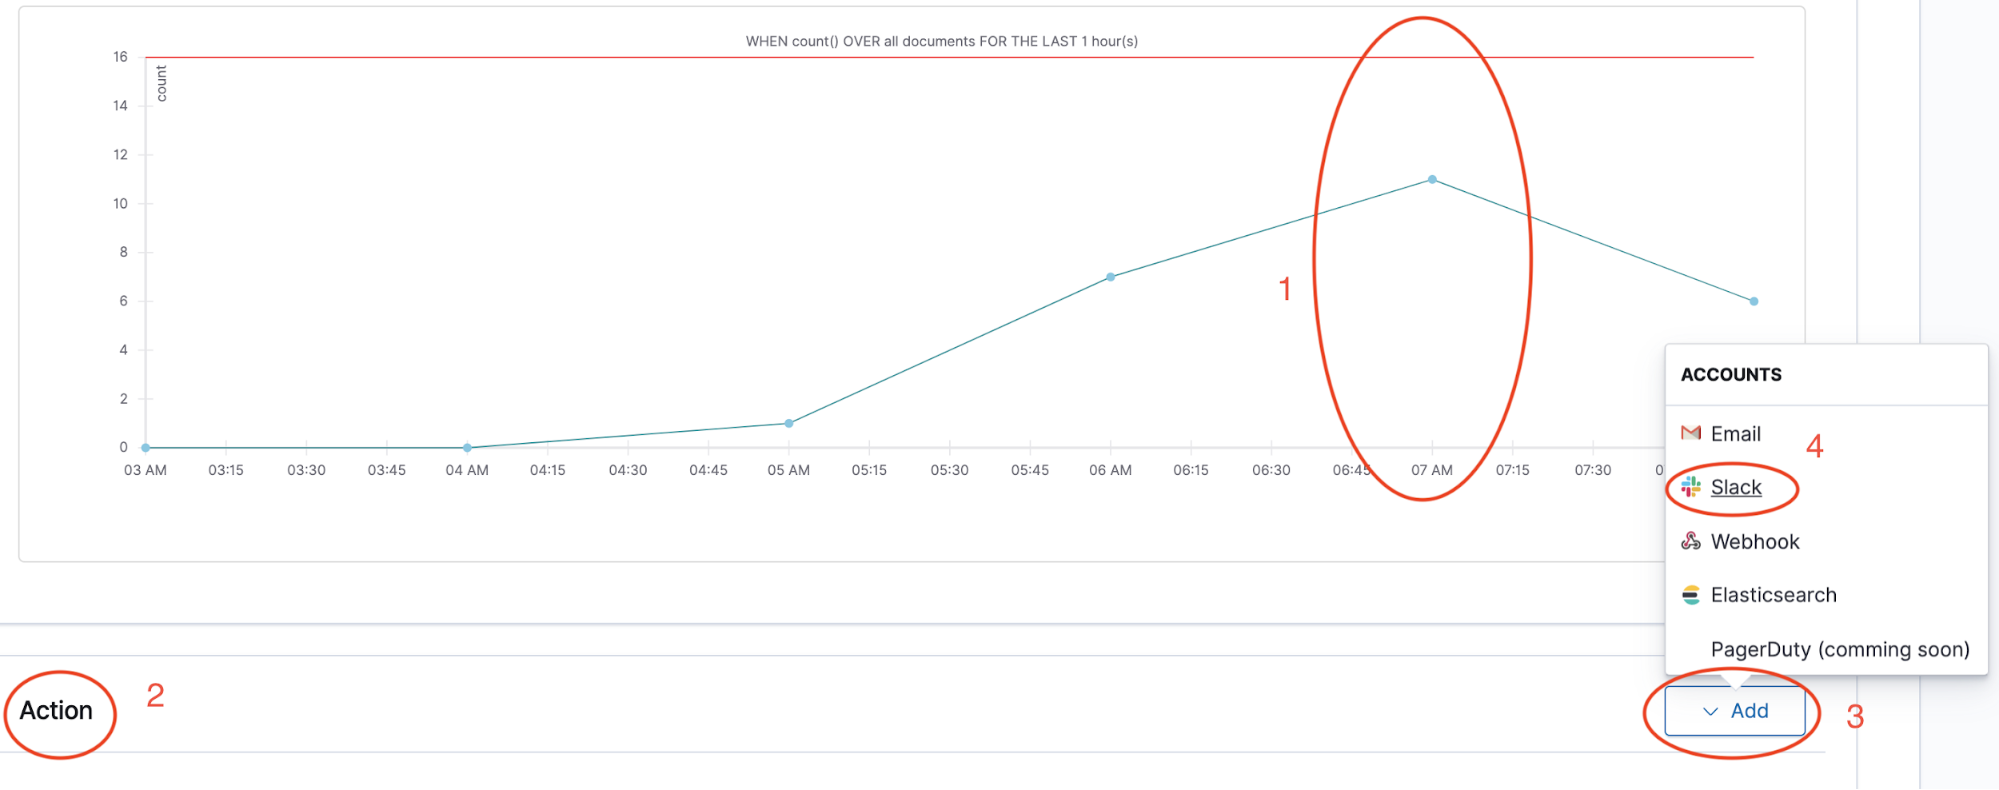
The Graph Mode presents values of the specified condition changed with time. This helps a lot to specify a proper threshold to fire a signal.
Next, we define an action to be triggered when the condition is matched. By clicking “Add” -> “Slack”, Slack action will be added. In order for action to work, you have to select a slack “Account”. Also, you can template action "Body" text using mustache and watch results. To see the watch query results, click the "watch results" link you see in the help text below the "Body".

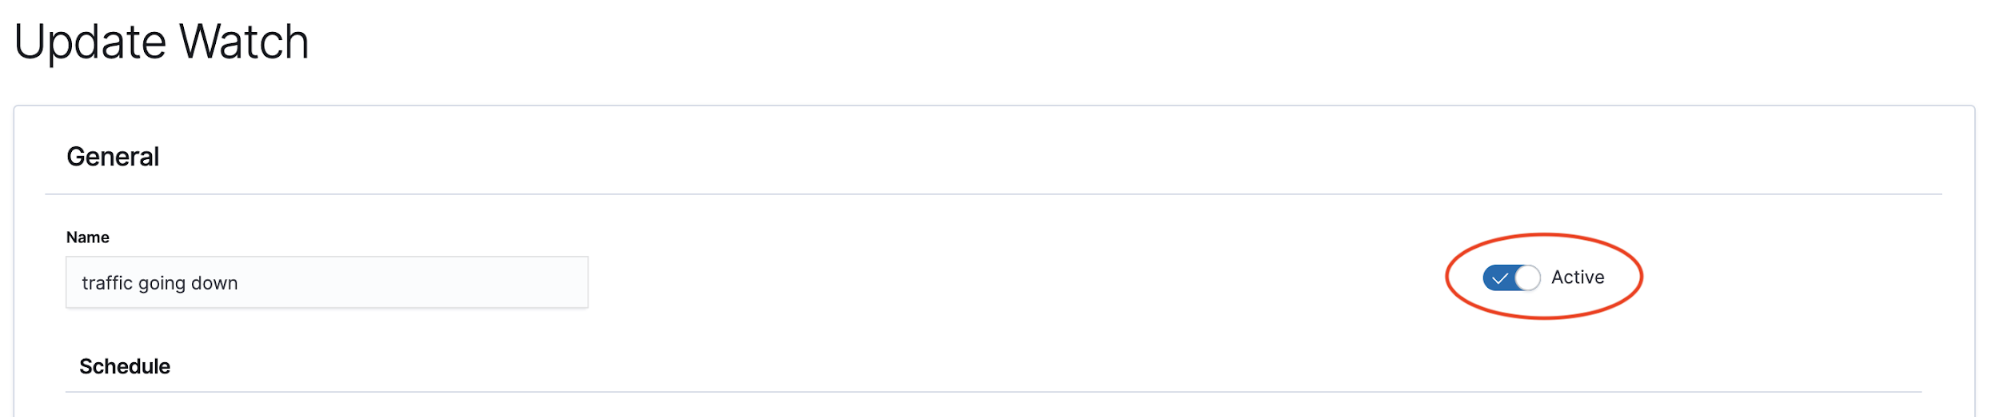
Slack notifications will be sent within a minute after saving the watch. “Dashboard” presents statuses of each watch run:

In order to stop the watch, we need to update it and switch off the “Active” flag.
Within a few easy to click steps, we were able to create a useful watch that triggers Slack notifications. If you find it interesting, please the other posts to see other Signals features.
Where to go next
Deep dive into all Signals features by reading the documentation
Download and install the latest Signals versions
Ask any questions on the Search Guard Signals forum
Image: Shutterstock / mix3r
Published: 2019-12-12
Summarize this with AI
Questions? Drop us a line!
Other posts you may like

Signals: Enterprise Alerting for Elasticsearch for Free
Jochen Kressin || 2024-10-15
We dive into Signals, our enterprise grade Alerting solution for Elasticsearch and Kibana. You can get the Community Edition for free!
read more

Log Monitoring with Signals Pt.1: Setting up Notification Channels
Jochen Kressin || 2024-07-18
In this article series, we will show you how to use Signals to monitor ingested log data for anomalies and send notifications on various channels if such an anomaly is detected.
read more
Alerting: Creating webhook actions
Sergii Bondarenko || 2020-02-19
How to use the Signals Alerting Kibana plugin to create Elasticsearch alerts and push notifications to any webhook endpoint
read more