Signals Alerting GA released
Tags: Alerting

After many months of hard work, we are thrilled to announce that Signals, the Enterprise Alerting solution for Elasticsearch has finally be released GA.
Signals can be used to examine data in your Elasticsearch cluster or data from other data sources, detect anomalies, and generate notifications if anything looks odd.
And the best thing is - the Signals Community Edition even comes for free!
Multiple data input sources
The most obvious data source that Signals can use is, of course, Elasticsearch. You can examine data from local or remote clusters, and scan the data for anomalies.
However, Signals also works with data from other endpoints. The first release of Signals ships with an HTTP adapter which you can use to pull in data from any HTTP REST endpoint. Signals also supports authentication (HTTP Basic, JWT and client certificates) and TLS.
We are planning for many more input sources in the next versions of Signals. If you have a specific input source in mind, please create a feature request on the Signals forum.
Working with your data
To work with your data, set up a data processing pipeline. Any pipeline can be as simple or complex as it needs to be, and mainly consists of the following two major blocks:
Data transformation and combination
Use the Elasticsearch Painless scripting language to
create calculations and data transformations
combine data from different sources
Dynamic conditions and severity levels
When looking for anomalies in data, for example, log files, this almost always includes configuring one or more conditions that define whether a specific value is abnormal or not. Like, the number of errors in the last 15 minutes.
Signals supports both a traditional model based on severity levels, and fully dynamic conditions.
You can define any number of conditions anywhere in your pipeline. Conditions, as well as transformations and calculations, have full access to all your runtime data!

Signals supports both a traditional model based on severity levels and fully dynamic conditions
Actions: Versatile output channels
If the conditions in your pipeline are met, the configured actions are executed. Actions can be used for:
Writing data back to Elasticsearch or to any webhook.
Since you can also use the full range of transformations, calculations, and conditions in any actions, you can easily set up an escalation model for your notifications.
Controlling notification frequency
To control the number of notifications that Signals will send out, you can use the throttling or the acknoledgement feature.
Throttling tells Signals to send a notification only once per defined interval. For example, you can tell Signals that you only want to receive one notification every 30 minutes, not every time the watch fires. Throttling can also be exponential, so you receive the first notification after 2 minutes, then after 4 minutes, then after 8 minutes, and so on.
Configuring Signals: REST API and Kibana UI
Signals can be configured by either using the REST API or the Kibana UI.
The REST API gives you complete control over all configuration settings. At the same time, our Kibana UI makes it super easy to implement watches without having to touch code.
Use the Kibana UI for easy configuration
Kibana UI: Three operation modes
The Kibana UI comes with three operation modes:
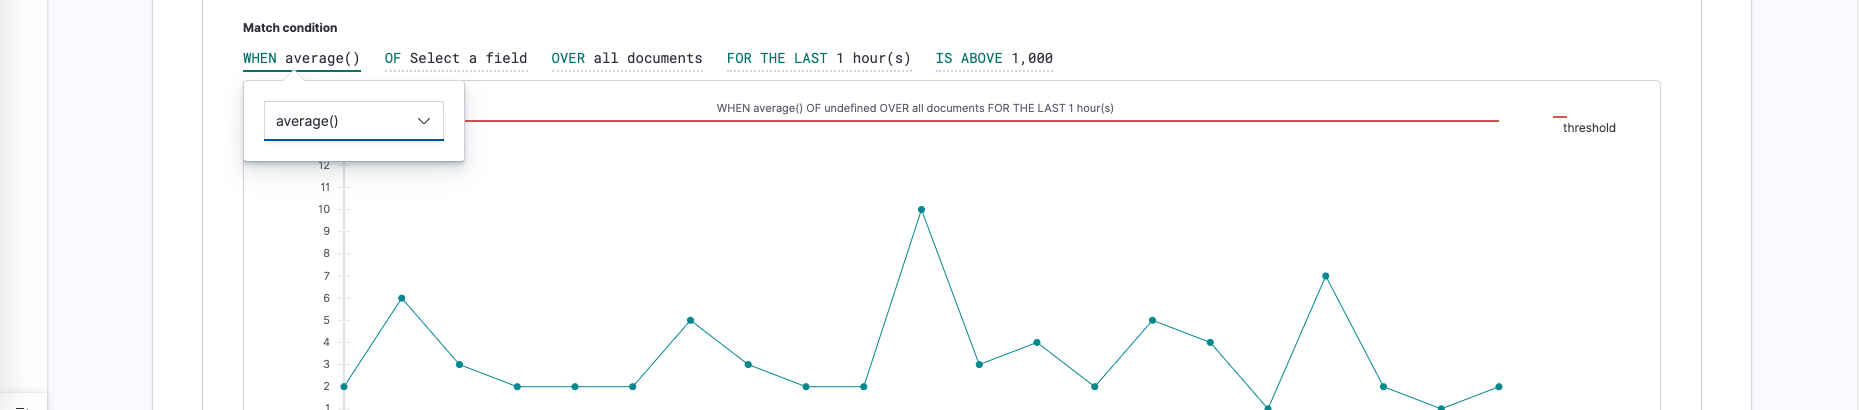
Graph mode
The graph mode makes it possible to configure watches without the need to deal with JSON. Every configuration change is a simple point-and-click operation.
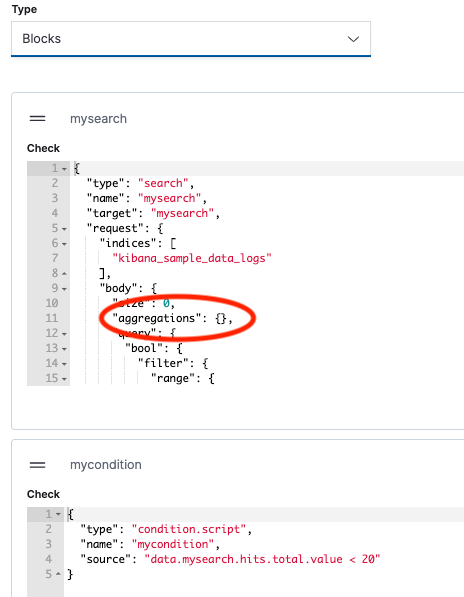
Block mode
In block mode, you can configure and test each section of your processing pipeline separately. Blocks are defined in JSON. To make configuration easier, Signals provides pre-defined blocks like data inputs, scripts and conditions which you can add by a simple click.
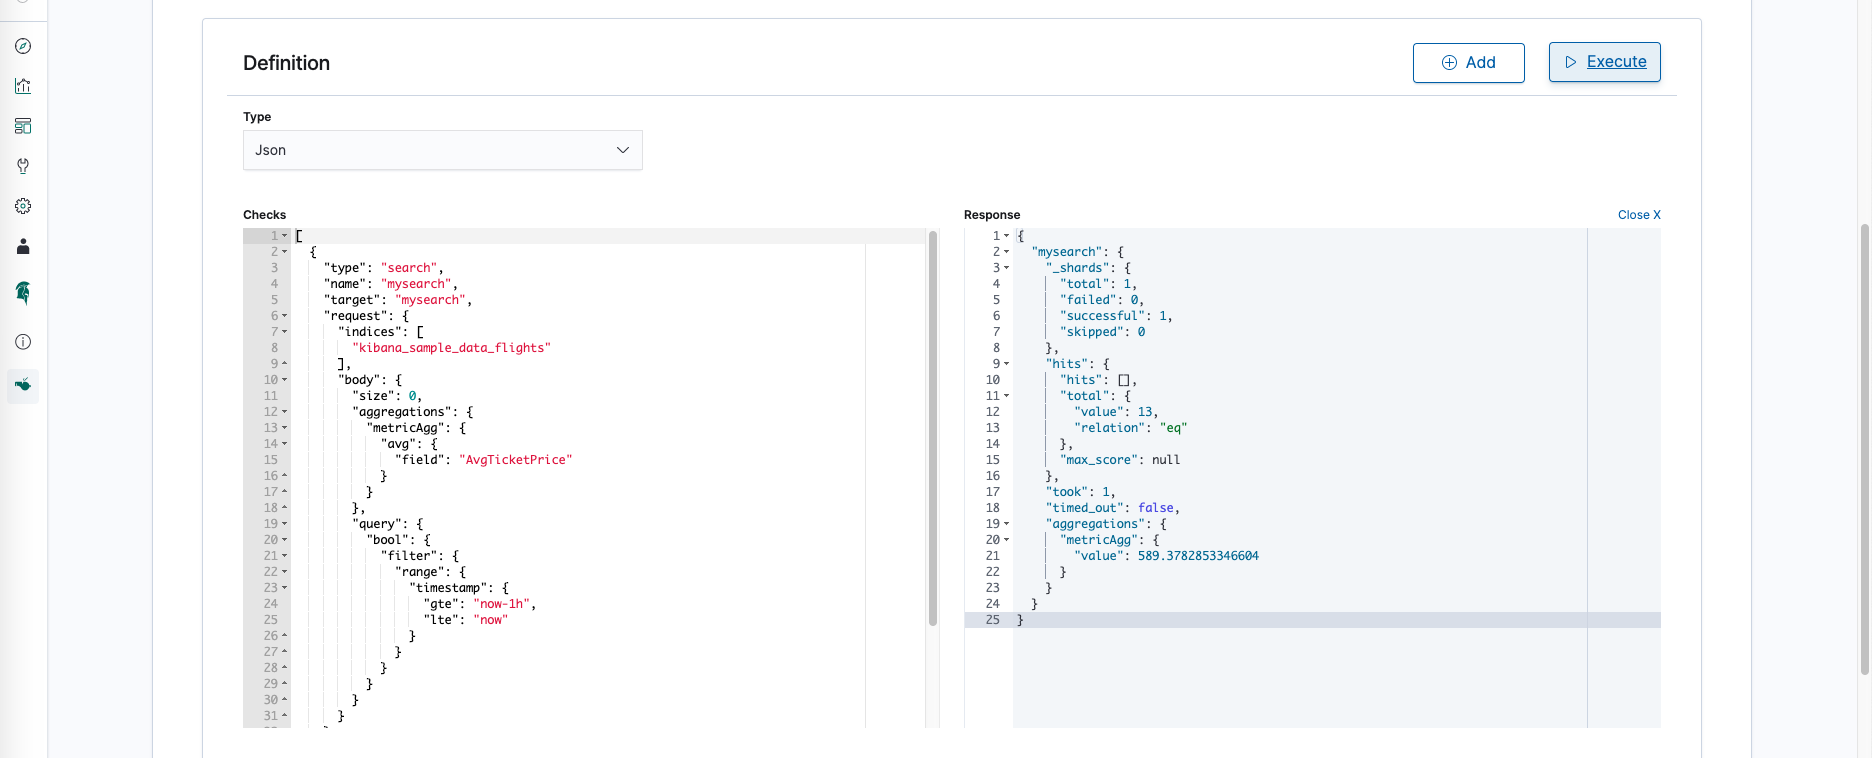
JSON mode
The JSON mode gives you the full control over watches, but also requires you to work with plain JSON.
What's next?
The GA release is just the first step towards a broad range of new features that we will be releasing build on top of Signals. And of course we will be extending the Signals core feature set as well.
So what to do next?
give Signals a spin by installing Search Guard v40 or above
try out one of the sample watches for a quickstart
read the "Signals Alerting: First Steps" post
Ask any questions on the Signals Community Forum
Image: shutterstock / lexaarts
Published: 2020-01-22
Summarize this with AI
Questions? Drop us a line!
Other posts you may like

From Alert Fatigue to Actionable Intelligence: Turning Noise into Insight with Search Guard
Daniel Gleim || 2026-04-07
This blog post explains how SearchGuard's Signals offers effective tools to minimize irrelevant alerts and highlight meaningful issues
read more

Signals Alerting: First steps
cstaley || 2019-12-12
Signals provides free enterprise alerting features for Elasticsearch and is fully compatible with all Search Guard security features.
read more

Alerting: Using the Kibana Block Mode
Cliff Staley || 2020-02-10
How to use the block mode of the Kibana Signals Alerting plugin to easily create watches, thresholds and notifications.
read more